TISGraph is a document-centric modular reporting tool for time-series data
TISGraph allows to visualize time-series data from diverse sources. TISGraph features an extensive toolset for quick and precise layouting of large amounts of data. Whether you want to informally visualize your data or need to compile reports for the authorities, TISGraph lets you simply do it.
TISGraph is developed by ITEG GmbH in close cooperation with KISTERS.
TISGraph’s Key Features …
- Display data from KISTERS WISKI and a wide variety of other sources
- Create data-centric reports with no design constraints
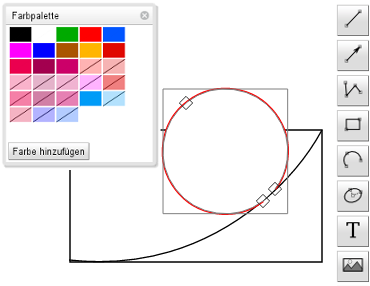
- Layout printer-ready documents with precise positioning of graphical elements
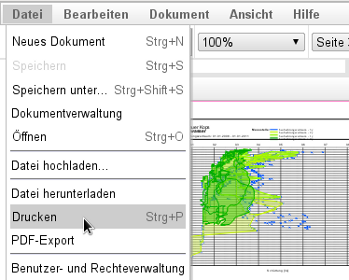
- Export reports to PDF for easy sharing and archiving
- Full-featured vector graphics
- Browse through time ranges interactively and easily
- Custom data source adapters and rendering tools available on request
- Display continuously updated live data
Creating Charts
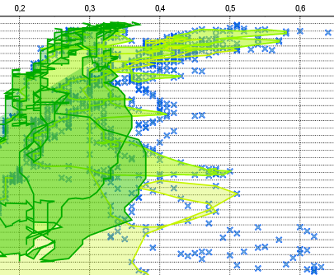
TISGraph makes it easy to present graphical data from various sources. TISGraph provides tools to display datasets using time- or parameter-driven charts.You can tune the chart’s appearance to match your needs with a variety of presentation models. The labellings of the axes dynamically adapt their divisions to the displayed scales for maximum readability.
Data Tables
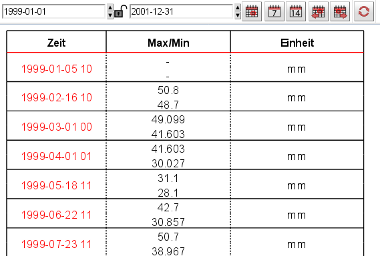
When exact numeric values of measurements matter, you can create tables with TISGraph. As with graphs, data in tables can be drawn from various sources. Tables can “roll out” the data in any direction, both horizontally and vertically. There are virtually no constraints on the cell layout and size of the repeated elements. The formatting features are as extensive as in well-known office suites.
Custom Add-Ons
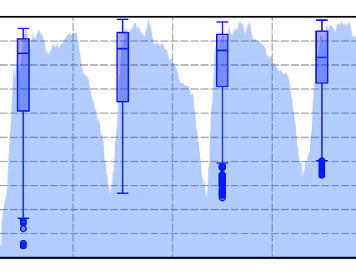
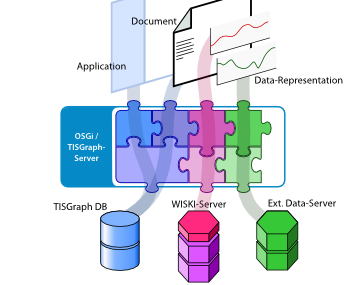
The modular approach makes TISGraph ready for custom extensions of its presentation capabilities. For example, isopiestic line charts and envelope curves are available as extension modules.
By default, TISGraph relies on KISTERS WISKI or TSM-Server as a data source. However data sources are extensible too, and can be aquired as extension modules. Data from all installed source adapters may be used in a single document, making it easy to compare data from different sources.
Importing Images
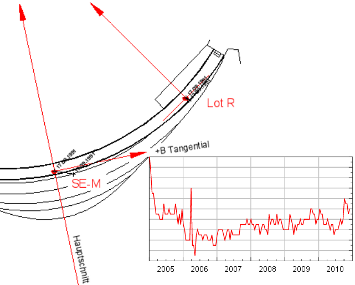
Image files in most common formats can easily be included in TISGraph documents. Most notably, TISGraph supports importing PDF documents. For example, construction plans or maps can be combined with data from your actual instruments.
Creating Document Layouts
Archiving and Sharing
Data Analysis
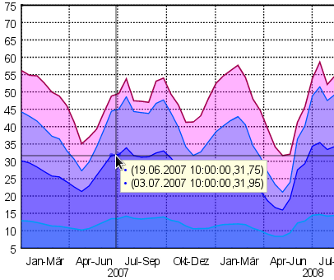
TISGraph provides an extensive toolset for direct data analysis. You can quickly check a dataset for exact values and plausibility by just moving the mouse over the relevant portion of the chart.
Browsing through Time
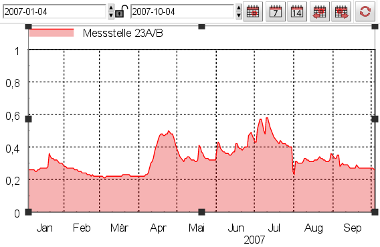
In TISGraph you can change the displayed time range on the fly, with direct feedback. Time ranges for indivdual charts can not only be defined absolutely but also as relative offsets (i.e. “previous year”).
TISGraph supports multiple time ranges in a single document. For following live data, TISGraph provides a refresh-button for updating charts immediately.
Modular Extensibility
Technology

TISGraph utilizes state-of-the-art web technologies to deliver a stunning user experience directly to the browser. It is not necessary to install any software on the clients, TISGraph supports any OS with an up-to-date, standards-compliant browser. The TISGraph server is Java based and therefore equally deployable on Windows and Linux servers.
